1. Slowing global population growth rate
The global population, the total number of humans currently living, stands at 7.8 billion people as of January 2021. Although the rate of growth is predicted to slow, the medium-variant projection estimates a global population of 8.5 billion by 2030, 9.7 billion by 2050 and 10.9 billion by 2100.
Office for National Statistics figures suggest the UK population will surpass 69.6 million by mid-2029 and reach 72 million by mid-2041.
The world’s population continues to grow, albeit at a slower pace than anytime since 1950
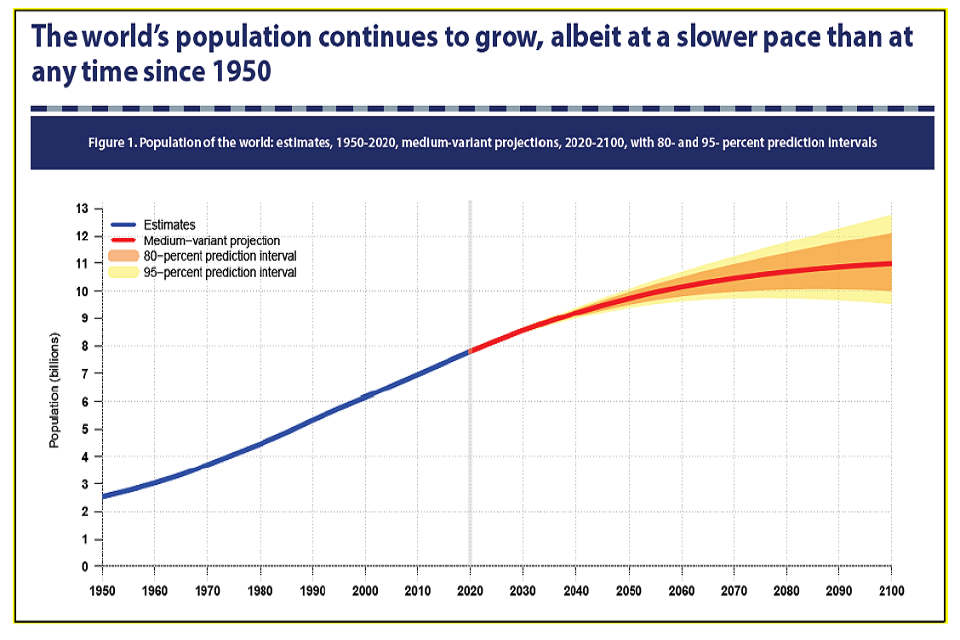
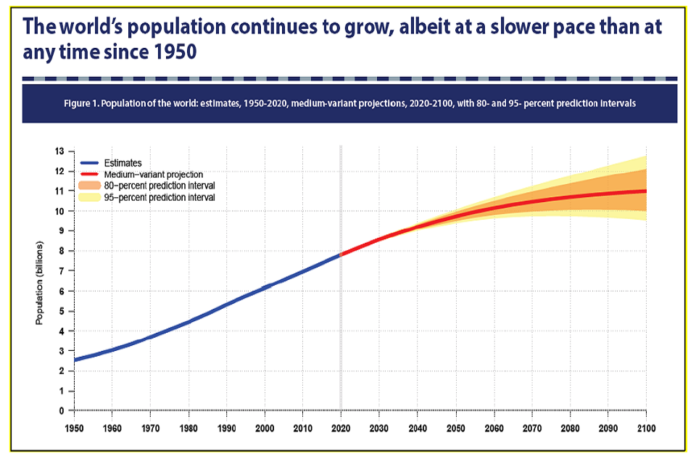
The bold blue curve refers to estimates for the period 1950 to 2020. The bold red curve shows the medium-variant projections for the period 2020 to 2100. The uncertainty of these projections is expressed using prediction intervals around the medium variant: shaded in orange for 80% intervals and yellow for 95% intervals. The results indicate that the global population is likely (95%) to number between 8.5 and 8.6 billion in 2030, between 9.4 and 10.1 billion in 2050, and between 9.4 and 12.7 billion in 2100. Thus, uncertainty about the size of the world’s population in 2030 and 2050 is relatively small but increases rapidly for projections extending into the second half of the century. Although the most likely scenario is that the world’s population will continue to grow throughout the present century, there is an estimated 27% probability that it could stabilise or even begin to shrink sometime before 2100.
Sources:
- World Population Prospects 2019: Data Booklet. United Nations.
- Overview of the UK population: January 2021, Office for National Statistics.
2. Decreasing total global fertility, falling below natural replacement levels
Globally, the level of fertility is projected to decrease from an average of 2.5 live births per woman in 2019 to 2.2 in 2050 and to 1.9 in 2100. Today, nearly half of the global population lives in a region where lifetime fertility sits below 2.1 births per woman – the natural replacement level.
In 2019, the total fertility rate in England and Wales fell to 1.65 children per woman, a 2.9% decrease from 2018. The rates have been decreasing year on year since 2013.
Total fertility (births per woman) by SDG region, estimates, 1950 to 2020, and medium-variant projections, 2020-2100
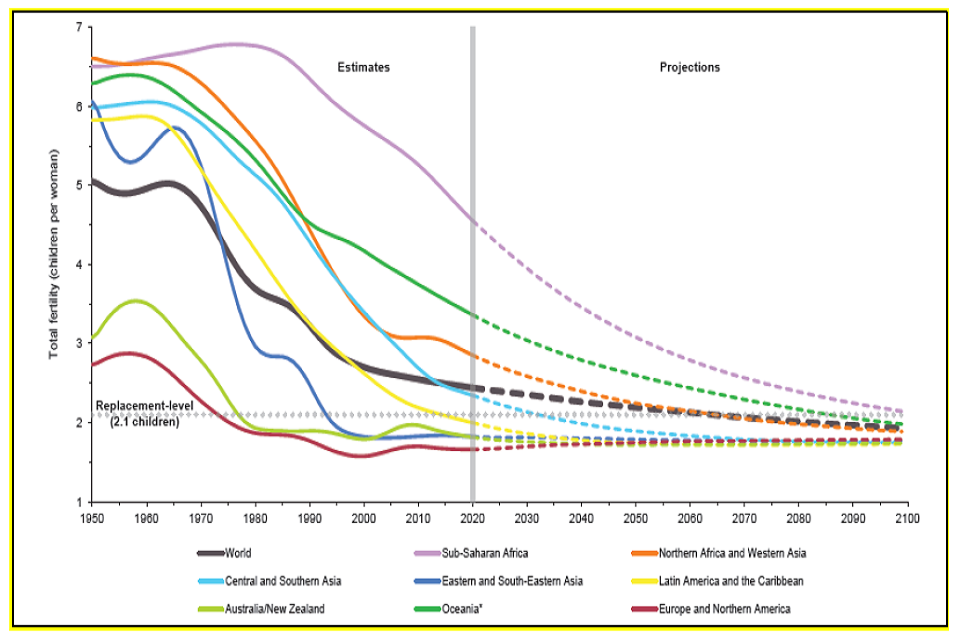
The average number of live births per women over a lifetime has fallen markedly in many regions over the past several decades. Today, close to half of the global population lives in a country or area where lifetime fertility is below 2.1 births per woman (roughly the level required for populations with low mortality to have a growth rate of zero in the long run). In 2019, fertility remains above this level, on average, in sub-Saharan Africa (4.6), Oceania (3.4), Northern Africa and Western Asia (2.9), and Central and Southern Asia (2.4). Globally, the level of fertility is expected to fall from an average of 2.5 live births per woman in 2019 to 2.2 in 2050 and to 1.9 in 2100, according to the medium-variant projection. The largest reductions in the level of total fertility are projected to occur in sub- Saharan Africa.
Sources:
- World Population Prospects 2019: Data Booklet. United Nations.
- Births in England and Wales: 2019. Office for National Statistics.
3. Doubling of global over 65s by 2050
Between 2019 and 2050, the number of persons aged 65 years or over globally is projected to more than double, while the number under age 25 is projected to reach a peak and then to decline slightly. It is expected that by 2050 or soon thereafter, the number of persons aged 65 or over will outnumber those under age 25 in Eastern and South-Eastern Asia, Latin America and the Caribbean, and Europe and Northern America.
Global population aged 0 to 24 and 65 or over estimates, 1950-2020
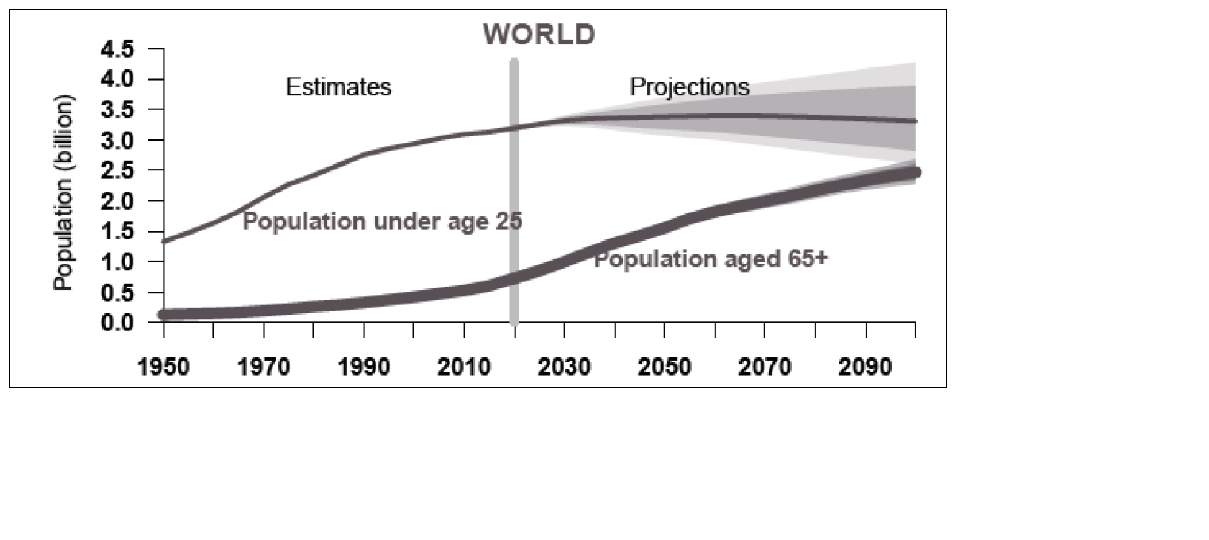
Estimates for the period 1950 to 2020 are shown as a thin coloured line, and the medium-variant projections for the period 2020 to 2100 are in bold. The uncertainty of these projections is expressed using prediction intervals around the medium variant: in darker shades for 80 per cent intervals and lighter shades for 95 per cent intervals.
Sources:
- World Population Prospects 2019: Data Booklet. United Nations.
4. Increase in over 65s to more than a quarter of the UK population by 2066
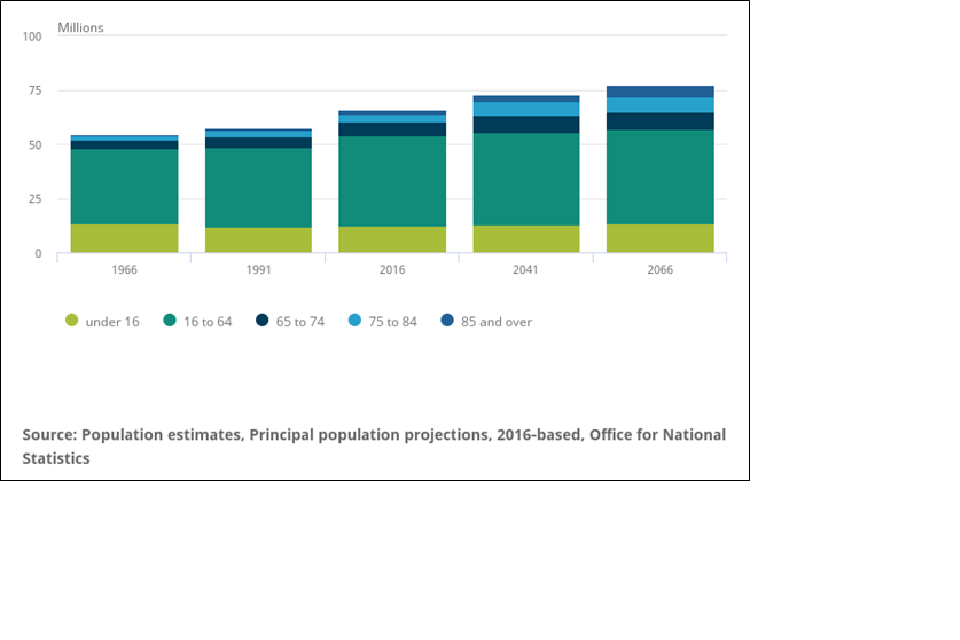
By 2066 there is projected to be a further 8.6 million UK residents aged 65 years and over. The total number in this group could be 20.4 million, up to 26% of the total population. The fastest increase will be seen in the 85 years and over age group.
Within the UK, the older population is not equally spread across local areas, with older people making up higher proportions of the populations of rural and coastal areas than urban areas. Five of the 10 local authorities with the highest percentage of the population aged 65 years and over are in the South West of England.
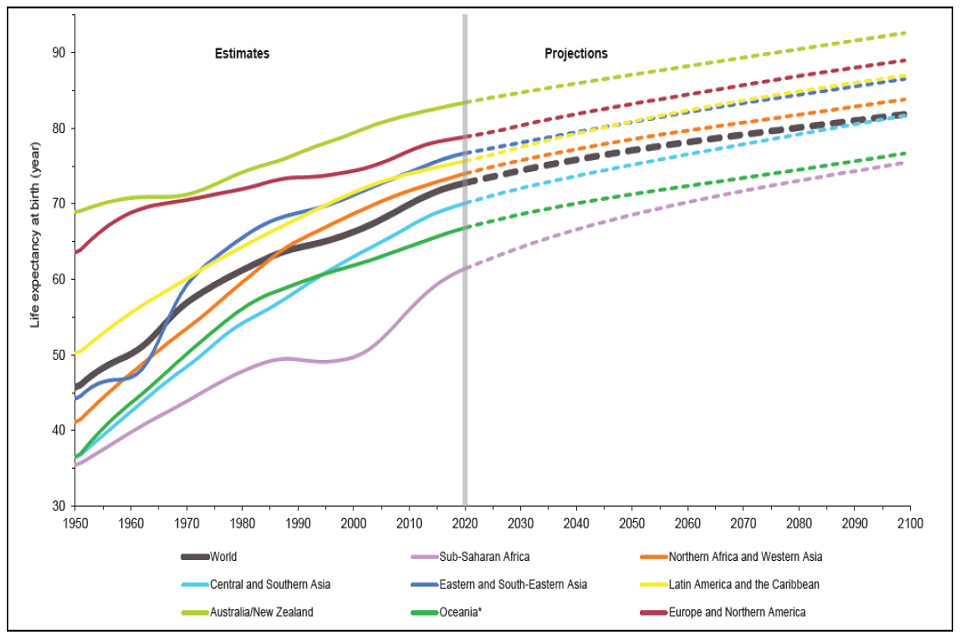
Life expectancy at birth (both sexes) estimates, 1950 to 2020
Source:
- Living longer: how our population is changing and why it matters, Office for National Statistics, August 2018.
5. Increase in global life expectancy of 8 years over the last two decades
Global life expectancy at birth reached 72.6 years in 2019, an increase of 8 years from 1990. It is expected to further increase to 77.1 years in 2050 with increases in every region. Sub-Saharan Africa is making the greatest gains, closing the life expectancy gap with improvement in survival adding nearly 12 years to the average length of life since 1990, reaching 61.1 years in 2019.
Life expectancy at birth (both sexes) estimates, 1950 to 2020
Sources:
- World Population Prospects 2019: Data Booklet. United Nations.
6. Increasing UK population but at a slower rate
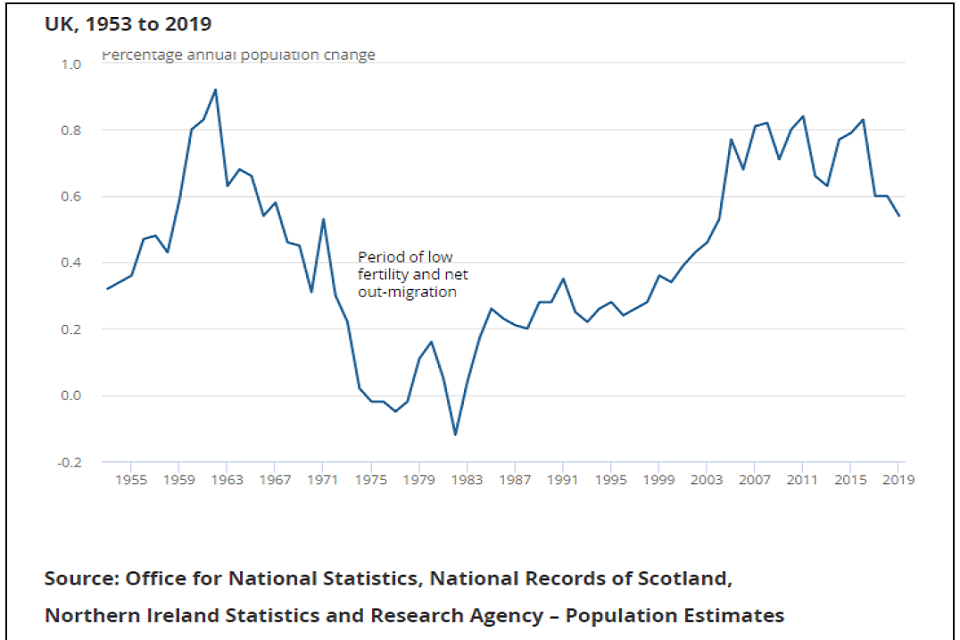
In mid-2019, the population of the UK was 66.8 million. Over the year to mid-2019, the population of the UK increased by 0.5%, or 361,000 people.
Decreasing numbers of births and net international migration have resulted in the slowest rate of growth that the UK has seen in 15 years, returning it to the level seen in mid-2004. Despite population growth slowing, 2019 was the 37th consecutive year (since 1982) that the total UK population has increased.
UK population continues to grow in mid-2019, but at a slower rate than any year since mid-2004.
UK, 1953 to 2019, percentage annual population change
Source:
- Population estimates for the UK, England and Wales, Scotland and Northern Ireland: mid-2019, Office for National Statistics.
7. International migration drives major population change in some countries
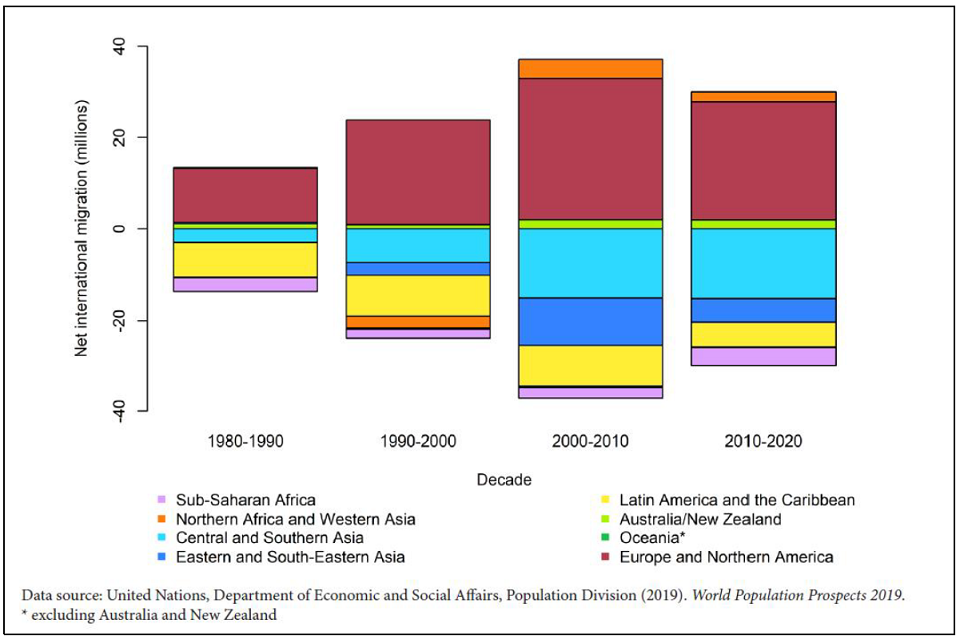
In some parts of the world, international migration has become a major component of population change. Between 2010 and 2020, 36 countries or areas experienced a net inflow of more than 200,000 migrants. For several of the top receiving countries, including Jordan, Lebanon and Turkey, large increases have been driven mostly by refugee movements, in particular from Syria.
It is estimated that ten countries experienced a net outflow of more than one million migrants between 2010 and 2020. The highest outflows were for Bangladesh, Syria, and Venezuela. For many of these, losses are dominated by temporary labour movements, insecurity, and conflict.
Net international migration (the number of people coming to live in an area and the number leaving to live elsewhere) by United Nations Sustainable Development Goal region 1980 to 2020
Source:
8. Long-term international migration continues to add to the UK population
In the year ending March 2020, long-term international migration continued to add to the UK population. Current best estimates show that around 313,000 more people moved to the UK with an intention to stay for 12 months or more than left the UK (net migration). Between 2016 and 2019, long-term net migration, immigration and emigration have remained broadly stable. Data from 2019, prior to the coronavirus (COVID-19) pandemic, suggests that migration is changing with an increase driven by non-EU citizens arriving to study in the UK.
Net migration has increased since 2019.
Long-term international migration, UK, year ending June 2010 to year ending March 2020

Source:
- Migration Statistics Quarterly Report: August 2020, Office for National Statistics.
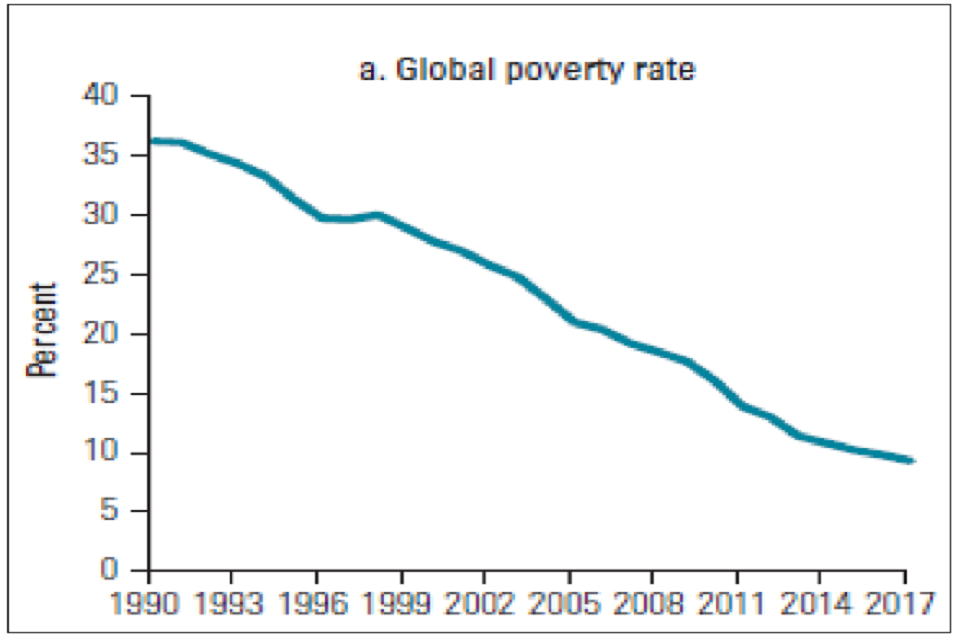
9. Long-term decline in extreme global poverty but the rate is slowing
Globally, extreme poverty, defined as living on less than $1.90 a day, dropped by an average of 1 percentage point per year from 1990 to 2015, but the rate has been slowing from 2013 onwards. Additional poverty measures, introduced by the World Bank in 2018, suggests that many millions of people in South Asia and sub-Saharan Africa had only narrowly escaped extreme poverty before the coronavirus (COVID-19) pandemic.
COVID-19 and its associated economic crisis, compounded by the effects of armed conflict and climate change, could reverse hard-won gains in poverty reduction.
Global Poverty Rate at the $1.90-a-Day Poverty Line, 1990 to 2017
Source:
- World Bank. 2020. Poverty and Shared Prosperity 2020: Reversals of Fortune. Washington, DC: World Bank. doi: 10.1596/978-1-4648-1602-4. License: Creative Commons Attribution CC BY 3.0 IGO.
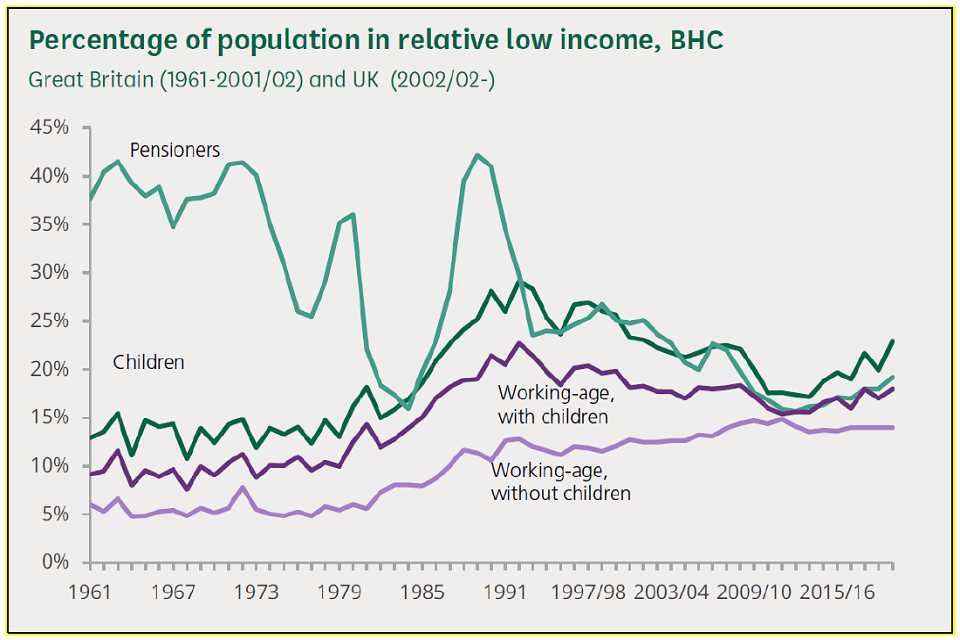
10. Long-term decline in UK pensioner poverty
The proportion of pensioners in relative poverty is much lower now than during the 1960s. Relative poverty rates for children and working-age adults rose during the 1980s. Despite some reduction for working-age adults with children, poverty rates for all groups are much closer than has historically been the case.
Official data on poverty during the coronavirus (COVID-19) pandemic will not be available until 2022. While it is too soon to measure the effects of COVID-19 on long term poverty rates, early analysis suggests it could present challenges. In the UK, an individual is in relative low income (or relative poverty) if they are living in a household with income below 60% of median household income in that year.
Percentage of population in relative low income, before housing costs (BHC)
Source: Institute for Fiscal Studies, using data compiled from the Family Resources Survey and Family Expenditure Survey; DWP. BHC = before housing costs
Source:
- Poverty in the UK: statistics, House of Commons Library Briefing Paper, March 2021.
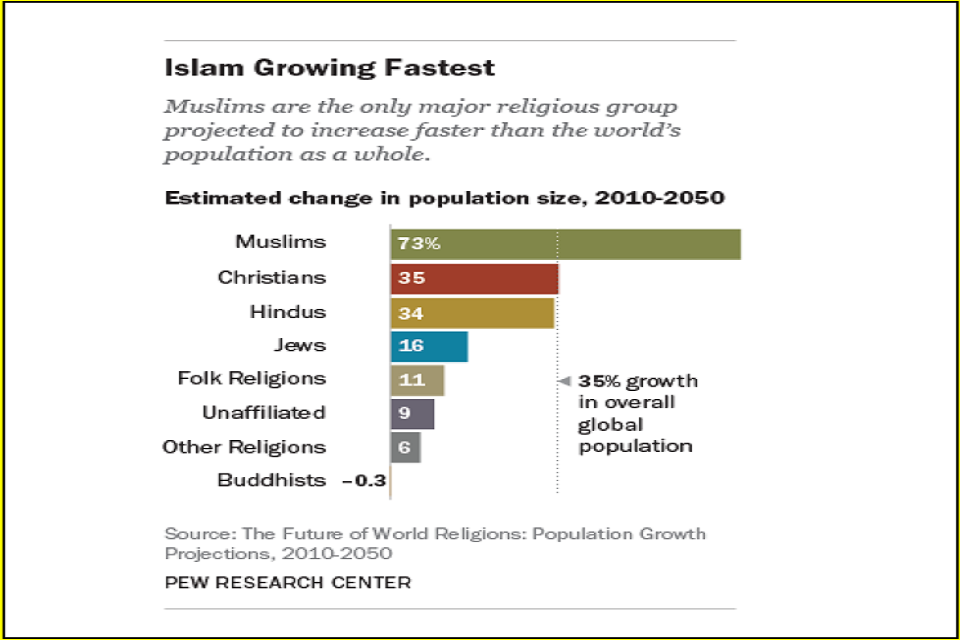
11. The world’s religious profile is changing
The religious profile of the world is changing, driven primarily by differences in fertility rates and the size of youth populations among the world’s major religions, as well as by people switching faiths.
If current trends continue, by 2050 the number of Muslims will nearly equal the number of Christians around the world. Atheists, agnostics and other people who do not affiliate with any religion, though increasing in some countries, will make up a declining share of the world’s total population. The global Buddhist population is projected to be about the same size it was in 2010, while the Hindu and Jewish populations will be larger than they are today.
The Future of World Religions: Population Growth Projections, 2010-2050
Sources:
- Pew Research Center, April 2, 2015, “The Future of World Religions: Population Growth Projections, 2010-2050”.
- Exploring religion in England and Wales: February 2020. Office for National Statistics.
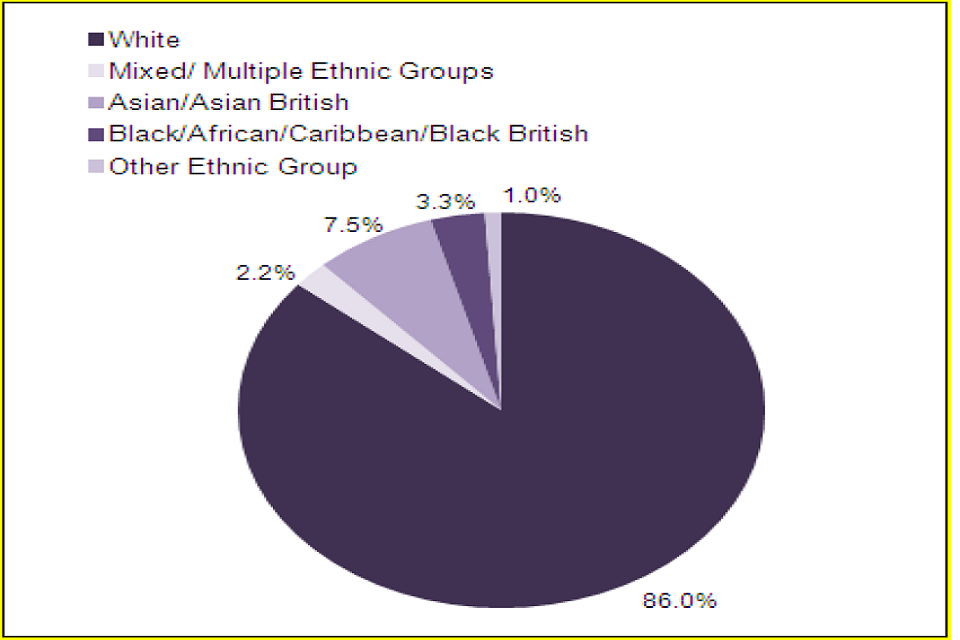
12. England and Wales are becoming more ethnically diverse
Between 1991 and 2001, the white ethnic group in England and Wales decreased to 91.3% from 94.1%. The trend continued between the 2001 and 2011 censuses, with a further decrease to 86%. Out of all regions, London had the smallest percentage of white British people, at 44.9%, and the North East had the highest percentage, at 93.6%. Ethnic groups are more likely to live in urban locations (over 98% of the population for Pakistani, Bangladeshi, and Black African communities).
Ethnic groups, England and Wales, 2011
Sources:
- Regional Ethnic Diversity.
- Ethnicity and National Identity in England and Wales: 2011, Office for National Statistics.
13. Fastest UK household growth has been in those containing multiple families
In 2020 there were 19.4 million families, an increase of 7.4% over the decade from 2010 to 2020. There were 2.9 million lone parent families in 2020, which accounts for 14.7% of families in the UK. The number of people living alone in the UK has increased by 4% over the last 10 years.
Households containing multiple families represent the smallest share of all households (1%) but are the fastest growing type of household over the last two decades, having increased by two-thirds to an estimated 278,800 households in 2020.
Couple households were the most common household type in 2019.
Percentages of households, by household type, UK 2019

Sources:
- Families and households in the UK: 2020, Office for National Statistics.
- Families and households in the UK: 2019 Office for National Statistics.
14. Increasing proportion of the UK population identifying as lesbian, gay, bisexual, and transgender
The proportion of the UK population identifying as lesbian, gay or bisexual (LGB) increased from 1.6% in 2014 to 2.2% in 2018. Younger people, aged 16 to 24 years, were most likely to identify as LGB in 2018 (4.4%). There are regional variations, people in London were most likely to identify as LGB (2.8%), with people in the North East the least likely (1.8%).
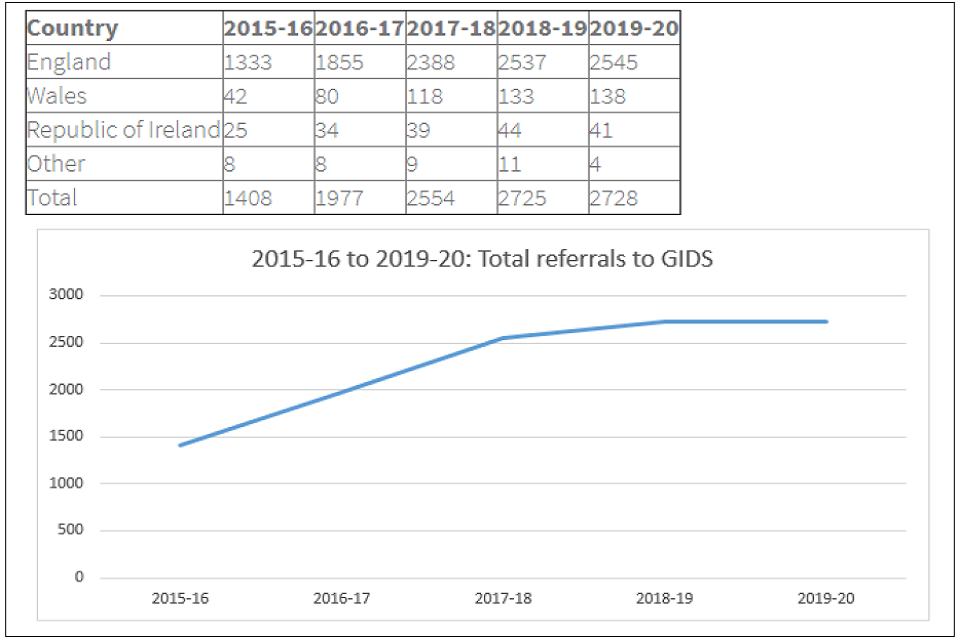
The UK government estimates that there are approximately 200,000 to 500,000 trans people in the UK. Referrals to the NHS Gender Identity Service show a steady increase with 2,728 patient referrals in 2019- and 2020.
Total referrals to Gender Identity Service
Sources:
- Sexual orientation, UK: 2018, Office for National Statistics.
- Referrals to Gender Identity Service financial years 2015 to 2016 to 2019 to 2020, NHS.

