
Research shows that lesbian, gay and bisexual (LGB) individuals are more likely to earn lower incomes, experience discrimination on the job, and encounter barriers in finding and advancing in employment, relative to their heterosexual counterparts.Note Recent Statistics Canada studies on the LGB population have focused on related issues such as educational attainment, housing and homelessness, and victimization, leaving a gap in research on the economic participation of this population. Income, education and employment, as well as challenges stemming from financial hardship, such as food insecurity, are key social determinants affecting the health and quality of life of individuals.
This article examines the labour and economic characteristics of LGB people in Canada, compared with the heterosexual population. It is part of a series intended to address gaps in the data on this smaller population by pooling various cycles of the Canadian Community Health Survey (CCHS, 2015 to 2016 and 2017 to 2018). In addition to this article and the release of a data table on the socioeconomic characteristics of the LGB population, the series explores the family and household characteristics and educational participation and attainment of LGB people in Canada. A forthcoming article will take a closer look at ethnocultural diversity among the LGB population.
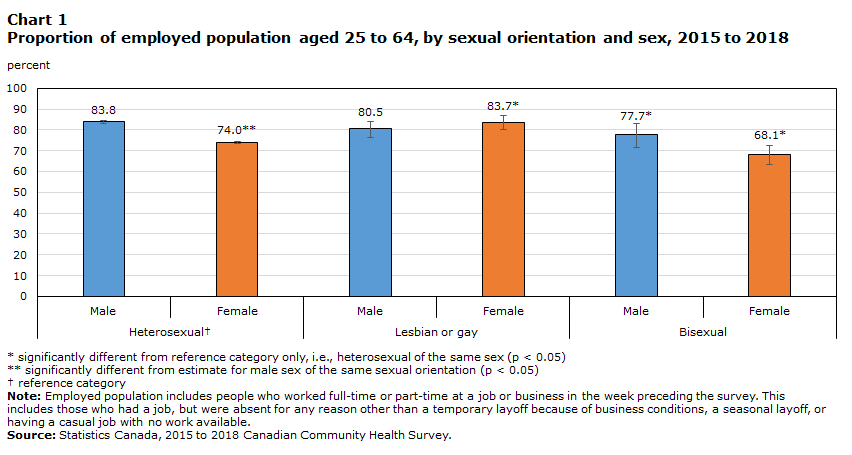
Heterosexual and bisexual women are less likely to be employed than lesbian women, heterosexual men and gay men
Over the 2015-to-2018 period, the majority (78.1%) of people aged 25 to 64 were employed full-time or part-time in the reference week; however, this varied by sexual orientation and gender.Note Overall, approximately 8 in 10 gay or lesbian (81.6%) and heterosexual (78.8%) individuals and 7 in 10 bisexual individuals (71.3%) in this age group were employed.Note Employment was highest among heterosexual men (83.8%), lesbian or gayNote women (83.7%), and gay men (80.5%). Bisexual men (77.7%) were less likely than heterosexual men to have been employed, while the differences between bisexual men and all other groups were not statistically significant. Generally lower shares of heterosexual women (74.0%) and bisexual women (68.1%) were employed—populations whose patterns of paid work may be shaped by caregiving roles, since child care and household responsibilities still fall primarily upon women in Canada (Chart 1).Note ,Note
Among the employed population, heterosexual women and bisexual women were less likely to work full-timeNote (81.5% and 79.7%, respectively) than heterosexual men and gay men (93.6% and 89.9%, respectively).
Data table for Chart 1
| Sexual orientation | Sex | Percent | 95% confidence intervals | |
|---|---|---|---|---|
| Lower | Upper | |||
| HeterosexualData table for Chart 1 Note † | Male | 83.8 | 83.2 | 84.3 |
| Female | 74.0Note ** | 73.4 | 74.6 | |
| Lesbian or gay | Male | 80.5 | 76.2 | 84.1 |
| Female | 83.7Note * | 80.2 | 86.7 | |
| Bisexual | Male | 77.7Note * | 71.5 | 82.9 |
| Female | 68.1Note * | 63.2 | 72.6 | |
Women of all sexual orientations and gay men are more likely than heterosexual men to work in sales and service jobs, as well as in business, finance and administration occupations
Research shows that people working in women-dominated occupations and industriesNote tend to be paid less than those employed in men-dominated occupations and industries, even when skill levels are comparable.Note Studies also suggest that gay men are more likely to work in women-dominated occupations, relative to their heterosexual counterparts. Likewise, lesbian women are more likely to work in men-dominated occupations, although the differential is more pronounced for gay men.Note LGB people may self-select into particular sectors based on preference or seek out environments thaat feel more inclusive, and this can have implications on earnings.Note Discrimination in the hiring process may also have an effect on employment in particular sectors. In a recent experiment focused on blue-collar jobs that controlled for applicant characteristics, heterosexual cisgender men received the highest number of call-backs—almost twice as many as LGBTQ2+ men.Note
Among full-time and part-time workers aged 25 to 64, sales and service occupationsNote ,Note were most common across all sexual orientations, but particularly so among the LGB population. Women of all sexual orientations and gay men were more likely than heterosexual men to work in sales and service jobs, which are among the lowest paid occupations.Note Compared with 16.3% of heterosexual men, around one-quarter of women across sexual orientations and gay men worked in sales and service occupations (Tables 1 and 2).Note
Women of all sexual orientations and gay men were also more likely to work in business, finance and administration occupations,Note relative to heterosexual men. Gay men (19.9%) and lesbian women (19.3%) were twice as likely to hold these occupations as heterosexual men (10.2%). An even higher share of heterosexual women (25.5%) and bisexual women (22.5%) worked in business, finance and administration positions (Tables 1 and 2).Note
Representation in occupations in education, law, and social, community and government servicesNote also varied according to gender and sexual orientation. Among men, only gay men had this occupational group in their top five occupations, yet their proportion was significantly lower (10.6%E) than heterosexual women (18.7%) and bisexual women (19.0%). Differences between gay men and lesbian women were not statistically significant (Tables 1 and 2).
Heterosexual men are the most likely to work in trades, transport and equipment operators and related occupations
Heterosexual men were the most likely of all groups studied to work in trades, transport and equipment operators and related occupations.Note One-quarter (25.2%) of heterosexual men and approximately one in seven bisexual men (15.1%E) worked in these occupations (Table 1). Gay men, as well as lesbian and bisexual women were less likely than heterosexual and bisexual men to work in these occupations,Note with the lowest proportion among heterosexual women (2.0%). Trades, transport and equipment operators and related occupations are generally higher paid than sales and service positions, and this may be a contributing factor to employment income disparities seen between heterosexual men and other groups studied. This topic will be explored further in a subsequent section of this article.
| Sexual Orientation | Occupation | Percent | 95% confidence intervals | |
|---|---|---|---|---|
| Lower | Upper | |||
| HeterosexualTable 1 Note † | Trades, transport, equipment operators and related occupations | 25.2 | 24.5 | 25.8 |
| Sales and service occupations | 16.3 | 15.7 | 17.0 | |
| Natural and applied sciences and related occupations | 13.7 | 13.2 | 14.2 | |
| Management occupations | 12.6 | 12.1 | 13.2 | |
| Business, finance and administration occupations | 10.2 | 9.7 | 10.6 | |
| Gay | Sales and service occupations | 24.8Note * | 19.8 | 30.6 |
| Business, finance and administration occupations | 19.9Note * | 15.3 | 25.5 | |
| Management occupations | 13.8 | 10.4 | 18.2 | |
| Occupations in education, law, social, community and government services | 10.6Note E: Use with caution | 7.9 | 14.2 | |
| Natural and applied sciences and related occupations | 8.7Note E: Use with caution Note * | 6.3 | 11.8 | |
| Bisexual | Sales and service occupations | 19.4Note E: Use with caution | 13.8 | 26.5 |
| Trades, transport, equipment operators and related occupations | 15.1Note E: Use with caution Note * | 9.8 | 22.5 | |
| Health occupations | Note F: too unreliable to be published | Note F: too unreliable to be published | Note F: too unreliable to be published | |
| Natural and applied sciences and related occupations | 11.8Note E: Use with caution | 8.3 | 16.5 | |
| Business, finance and administration occupations | Note F: too unreliable to be published | Note F: too unreliable to be published | Note F: too unreliable to be published | |
| Sexual Orientation | Occupation | Percent | 95% confidence intervals | |
|---|---|---|---|---|
| Lower | Upper | |||
| HeterosexualTable 2 Note † | Business, finance and administration occupations | 25.5Note ** | 24.8 | 26.2 |
| Sales and service occupations | 22.0Note ** | 21.4 | 22.7 | |
| Occupations in education, law, social, community and government services | 18.7Note ** | 18.1 | 19.3 | |
| Health occupations | 14.3Note ** | 13.9 | 14.9 | |
| Management occupations | 7.4Note ** | 7.0 | 7.8 | |
| Lesbian or gay | Sales and service occupations | 22.7 | 17.7 | 28.8 |
| Business, finance and administration occupations | 19.3Note * | 14.9 | 24.6 | |
| Occupations in education, law, social, community and government services | 17.2 | 13.7 | 21.2 | |
| Health occupations | 10.6Note E: Use with caution | 7.0 | 15.7 | |
| Management occupations | 10.1Note E: Use with caution | 6.4 | 15.7 | |
| Bisexual | Sales and service occupations | 26.9 | 22.2 | 32.1 |
| Business, finance and administration occupations | 22.5 | 18.0 | 27.8 | |
| Occupations in education, law, social, community and government services | 19.0Note ** | 15.2 | 23.5 | |
| Health occupations | 9.7Note E: Use with caution Note * | 7.2 | 12.8 | |
| Management occupations | 5.4Note E: Use with caution | 3.4 | 8.5 | |
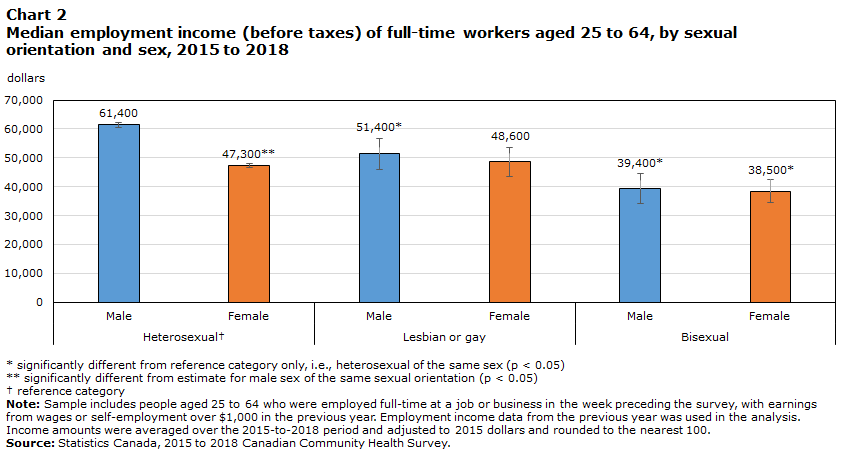
Bisexual individuals have significantly lower employment income than their heterosexual and gay or lesbian counterparts
The following section examines CCHS employment income data collected from a variety of sourcesNote averaged across the 2015-to-2018 period. Analysis is restricted to individuals who were employed full-time in the reference week and whose primary annual income came from wages, salaries or self-employment.Note The findings provide an indicator at the individual level of economic well-being of men and women of different sexual orientations.
Among the employed population aged 25 to 64, heterosexual people had the highest before-tax median earnings ($55,000), compared with gay or lesbian ($50,100) and bisexual ($39,200) individuals.Note Heterosexual men, with a median annual employment income of $61,400, made up the group with the highest earnings overall (Chart 2). Relative to heterosexual men, gay men had a lower median employment income ($51,400), and bisexual men earned less ($39,400) than their heterosexual and gay counterparts. Among women, lesbian and heterosexual women earned similar median incomes ($48,600 and $47,300, respectively), while bisexual women earned less ($38,500).
In contrast with the income disparity between employed heterosexual men and women ($61,400 versus $47,300), differences in employment income between gay men and lesbian women were not statistically significant, nor were the differences between bisexual men and women. However, gay men had higher employment income than bisexual women, and lesbian women earned more than bisexual men.
Data table for Chart 2
| Sexual orientation | Sex | Dollars | 95% confidence intervals | |
|---|---|---|---|---|
| Lower | Upper | |||
| HeterosexualData table for Chart 2 Note † | Male | 61,400 | 60,461 | 62,307 |
| Female | 47,300Note ** | 46,600 | 48,074 | |
| Lesbian or gay | Male | 51,400Note * | 46,008 | 56,714 |
| Female | 48,600 | 43,680 | 53,423 | |
| Bisexual | Male | 39,400Note * | 34,222 | 44,666 |
| Female | 38,500Note * | 34,534 | 42,436 | |
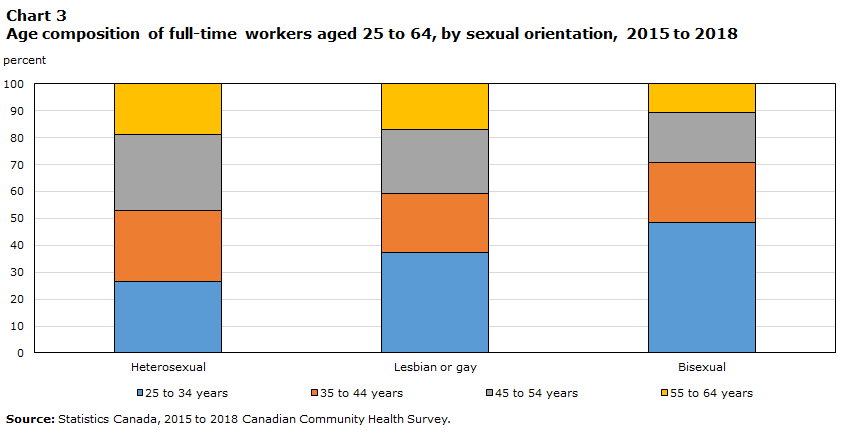
Among full-time workers aged 25 to 64, bisexual people were younger on average (38 years) than their gay or lesbian and heterosexual counterparts (41 and 43 years, respectively; Chart 3). The younger average age of the bisexual population suggests they may be in earlier stages of their careers; however, age may not fully explain differences seen in employment income. A significant earnings gap was also seen between the younger bisexual and heterosexual population. Bisexual women aged 25 to 34 earned lower median incomes compared with heterosexual women of the same age group, while the earnings gap was not statistically significant between bisexual and heterosexual women aged 35 to 64. Among men, the earnings gap experienced by younger bisexual men, relative to heterosexual men, persisted for bisexual men aged 35 to 64.
Data table for Chart 3
| Age group | Sexual orientation | ||
|---|---|---|---|
| Heterosexual | Lesbian or gay | Bisexual | |
| percent | |||
| 25 to 34 years | 26.5 | 37.5 | 48.5 |
| 35 to 44 years | 26.4 | 21.8 | 22.3 |
| 45 to 54 years | 28.3 | 23.8 | 18.6 |
| 55 to 64 years | 18.9 | 16.9 | 10.6 |
Heterosexual men tend to earn the highest incomes, compared with women of all sexual orientations and gay and bisexual men with the same level of education
The second article in this series, Educational participation and attainment of lesbian, gay and bisexual people in Canada, found that among the population aged 25 to 64, gay and lesbian people—gay men in particular—generally had higher educational attainment than their heterosexual counterparts. Relative to heterosexual men, a larger proportion of heterosexual women held a college or university qualification as their highest level of education. However, differences in college and university completion between women of different sexual orientations were not statistically significant. In contrast, heterosexual men were most likely to have obtained a trade qualification as their highest level of education, compared with women of all sexual orientations and gay men.
Educational attainment, occupation group and age are often used to explain income inequalities. However, findings presented here suggest that these factors cannot entirely explain the differences seen in employment income between people of different sexual orientations. Among full-time workers, heterosexual men aged 25 to 64 earned more than women of all sexual orientations and gay and bisexual men, whether their highest credential was at the college level, a skilled trade, or a high school diploma or less.Note Heterosexual men holding a bachelor’s degree or higher also had a higher median employment income than other groups studied with the same level of education, with the exception of gay men (differences not found to be statistically significant).
Among men holding a bachelor’s degree and above, both heterosexual and gay men earned higher before-tax median incomes ($77,200 and $68,900 respectively) than their bisexual counterparts ($39,900; Table 3), an income differential driven by the disproportionately younger population of bisexual men. University-educated bisexual men aged 25 to 34 earned less than heterosexual and gay men with the same level of education, while differences among men aged 35 to 64 were not statistically significant.
Younger bisexual women with a university degree earn lower employment incomes than their lesbian and heterosexual women counterparts
Among full-time workers, lesbian women and heterosexual women aged 25 to 64 holding a bachelor’s degree or higher earned similar before-tax median employment incomes ($69,100 and $64,200, respectively)—higher than bisexual women with the same qualification ($49,500). These differences were driven by the disproportionately younger population of bisexual women. University-educated bisexual women aged 25 to 34 earned less than their heterosexual and lesbian counterparts, while there was no statistically significant difference in employment income among women aged 35 to 64. Among women holding a college credential as their highest level of education, the earnings differential remained between heterosexual women ($44,700) and their bisexual counterparts ($37,200; Table 3).
Heterosexual men aged 25 to 64 with a trade certificate or diploma as their highest level of education received significantly higher annual compensation for their work ($60,000) than gay ($42,200) or bisexual men ($34,600; Table 3). Women of all sexual orientations with a trade credential as their highest level of education also had lower median employment incomes than heterosexual men with a trade qualification, although there was no statistically significant difference between women. This income differential could be explained by the fact that, according to data from the 2016 Census, lower-paying trades, such as hairstyling, are more common among women, while trade occupations that men commonly train for, such as electricians, are associated with higher earnings.Note
| Sex | Sexual orientation | Highest level of education | |||
|---|---|---|---|---|---|
| Secondary school or less | Trade certificate or diploma | College/CEGEP/ University qualification below bachelor’s |
Bachelor’s degree and above | ||
| dollars | |||||
| Male | HeterosexualTable 3 Note † | 50,000 | 60,000 | 61,700 | 77,200 |
| Gay | 39,700Note * | 42,200Note * | 45,000Note * | 68,900 | |
| Bisexual | 34,100Note * | 34,600Note * | 44,300Note * | 39,900Note * | |
| Female | HeterosexualTable 3 Note † | 36,100 | 35,200 | 44,700 | 64,200 |
| Lesbian or gay | 40,300 | 37,800 | 41,700 | 69,100 | |
| Bisexual | 30,200 | 29,500 | 37,200Note * | 49,500Note * | |
Among workers in sales and service occupations, heterosexual men earn higher incomes than men and women of other sexual orientations
Heterosexual men were less likely to work in sales and service jobs, yet still earned a higher median annual income in these occupations ($45,800) than all other groups studied. Among full-time workers aged 25 to 64 in sales and service occupations, heterosexual women had higher employment income ($32,500) than bisexual men ($25,000) and women ($24,800), who were among the lowest earners working in sales and service occupations.
Start of text box
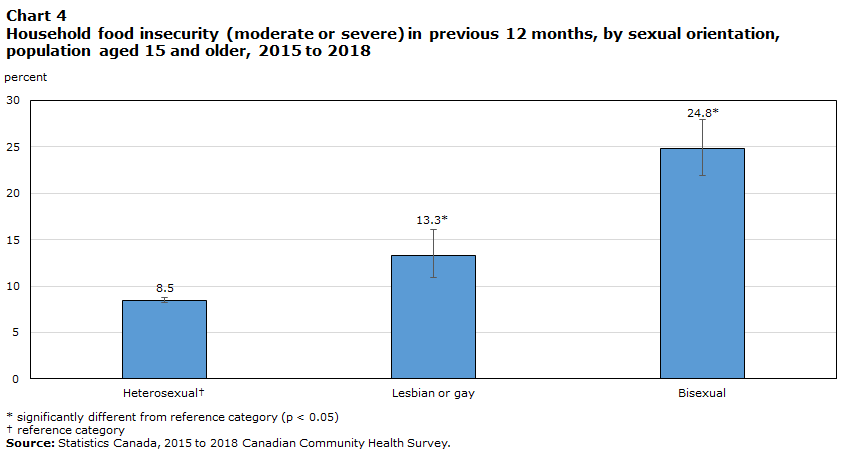
Household food insecurityNote occurs when a household’s access to food is inadequate or precarious due to insufficient financial resources to buy food. Moderate food insecurity is characterized by a compromise in the quality or quantity of food consumed, while severe food insecurity exists when household members miss meals and reduce food intake. These types of food insecurity are associated with poor physical and mental health outcomes.Note
Findings from the 2015 to 2018 CCHS show that the LGB population, and bisexual people in particular, were more likely to live in a household experiencing food insecurity than heterosexual people. Among the population aged 15 and older, one-quarter (24.8%) of bisexual people and one in eight gay or lesbian individuals (13.3%) experienced some moderate or severe food insecurity in their household in the previous 12 months (Chart 4).Note In comparison, 8.5% of heterosexual people experienced household food insecurity in the same time period. In other words, bisexual individuals were almost three times as likely as heterosexual people and nearly twice as likely as gay or lesbian individuals to live in a household that experienced food insecurity.
Data table for Chart 4
| Sexual orientation | Percent | 95% Confidence Intervals | |
|---|---|---|---|
| Lower | Upper | ||
| HeterosexualData table for Chart 4 Note † | 8.5 | 8.2 | 8.8 |
| Lesbian or gay | 13.3Note * | 10.9 | 16.1 |
| Bisexual | 24.8Note * | 21.9 | 27.9 |
Moderate or severe food insecurity also varied by gender and sexual orientation. Over one in four bisexual women aged 15 and older (27.4%) experienced moderate or severe food insecurity in their household in the previous 12 months—twice the percentage (13.0%) seen among lesbian women. While heterosexual women disproportionately lived in food insecure households compared with heterosexual men (9.6% versus 7.2%), differences between bisexual women and men (27.4% and 19.5%, respectively) were not statistically significant, nor were the differences between lesbian women and gay men (13.0% and 13.5%, respectively).
Severe food insecurity disproportionately affected LGB households—particularly households of bisexual people. One in 10 bisexual people aged 15 and older (10.8%) lived in households that experienced severe food insecurity in the previous 12 months—a proportion over three times higher (2.9%) than among their heterosexual counterparts. A larger share (5.0%E) of gay or lesbian people also lived in households experiencing severe food insecurity, relative to heterosexual households.
Food insecurity is also an issue affecting working people, since low salaries and precarious employment can result in the workforce not having sufficient income to afford a sufficient quantity or variety of food. Food insecurity rates among the employed populationNote aged 25 to 64 followed a similar pattern to the overall population. Despite being employed, bisexual workers were three times as likely as their heterosexual counterparts (21.9% versus 7.3%), and more likely than employed gay or lesbian people (21.9% versus 11.5%E), to live in a household that experienced moderate or severe food insecurity in the previous 12 months. Household food insecurity was also higher among employed gay or lesbian people than among their heterosexual counterparts (11.5%E versus 7.3%).
Household food insecurity remained high among employed bisexual women, despite their work status. One in four bisexual women workers (24.2%) experienced household food insecurity—significantly higher than employed lesbian (10.4%E) and heterosexual (8.5%) women.
End of text box
Note to readers
The Canadian Community Health Survey (CCHS) is a cross-sectional survey that collects information related to health status, health care utilization and health determinants for the Canadian population. With a sample of 130,000 respondents every two years, it is a well-suited data source for research on smaller populations such as lesbian, gay and bisexual people living in Canada.
The CCHS covers the population 12 years of age and older living in all provinces and territories. Excluded from the sampling frame are individuals living in First Nations communities (on reserve), institutional residents (health institutions, prisons, religious institutions, convents, etc.), full-time members of the Canadian Forces, youth aged 12 to 17 living in foster homes and residents of certain remote regions. The CCHS covers approximately 98% of the Canadian population aged 12 and older.
This article presents pooled data from the 2015-to-2016 and 2017-to-2018 cycles. Unless otherwise noted, the weights of the two two-year cycles were divided by two to represent the total average population over the four years. Prior to 2019, the CCHS only collected information on sex of respondent (male or female), as recorded by the interviewer. Although sex and gender refer to two different concepts, the terminology related to gender is used throughout this article to make it easier for readers. In 2019 and subsequent cycles, both respondent self-reported sex at birth and gender identity is collected.
The CCHS sexual orientation variable contained three response category options with the following definitions: heterosexual (sexual relations with people of the opposite sex); homosexual, that is lesbian or gay (sexual relations with people of your own sex); and bisexual (sexual relations with people of both sexes). In 2019 and subsequent cycles of the CCHS, the definitional text is omitted from these categories, and an additional response category is included for respondents to specify a sexual orientation beyond these three. Data from the 2019 CCHS were not included because of this change in reporting methodology and impacts on comparability for sexual orientation data.
For additional information about CCHS data quality and methodology.
This study was funded by Women and Gender Equality Canada (WAGE).


